
📊 Dashboard
The Woofix Dashboard gives you an instant overview of all the essential statistics related to your appointments, sales, and team performance. It is the main tool for analyzing your daily activities and making better decisions.
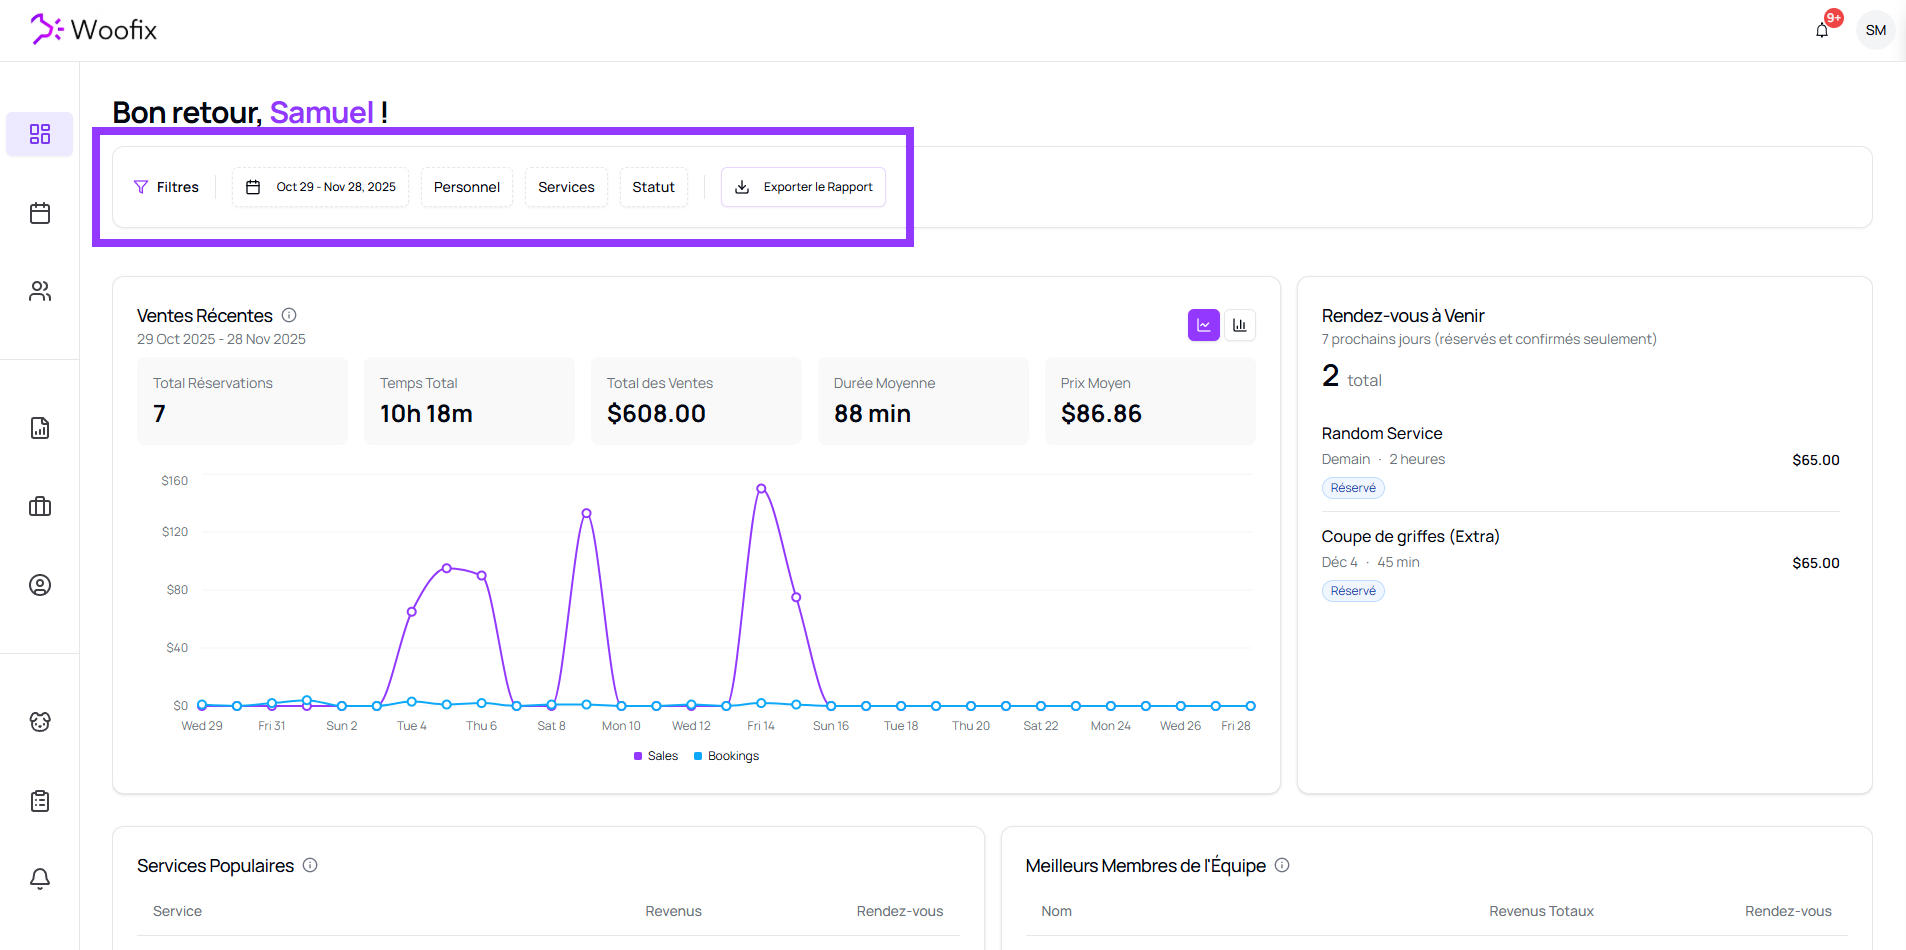
1. 🔎 Advanced Dashboard Filters
At the top of the page, you’ll find a series of filters allowing you to adjust all visible data:
1.1. Date Filter
- Select a start date and end date using the calendar picker.
- All statistics automatically recalculate based on the selected period.
1.2. Staff Members
- Choose one or multiple groomers.
- This filters the view to show only their appointments, sales, and performance.
1.3. Services
- Select one or more services.
- Useful for analyzing a specific type of service (bath, haircut, de-shedding, etc.).
1.4. Statuses
- Select one or more statuses (booked, confirmed, completed, cancelled, etc.).
- If no status is selected, the dashboard automatically displays only appointments with the “Completed” status.
1.5. Report Export
An Export Report button allows you to download a .csv file containing all appointments matching the selected filters.
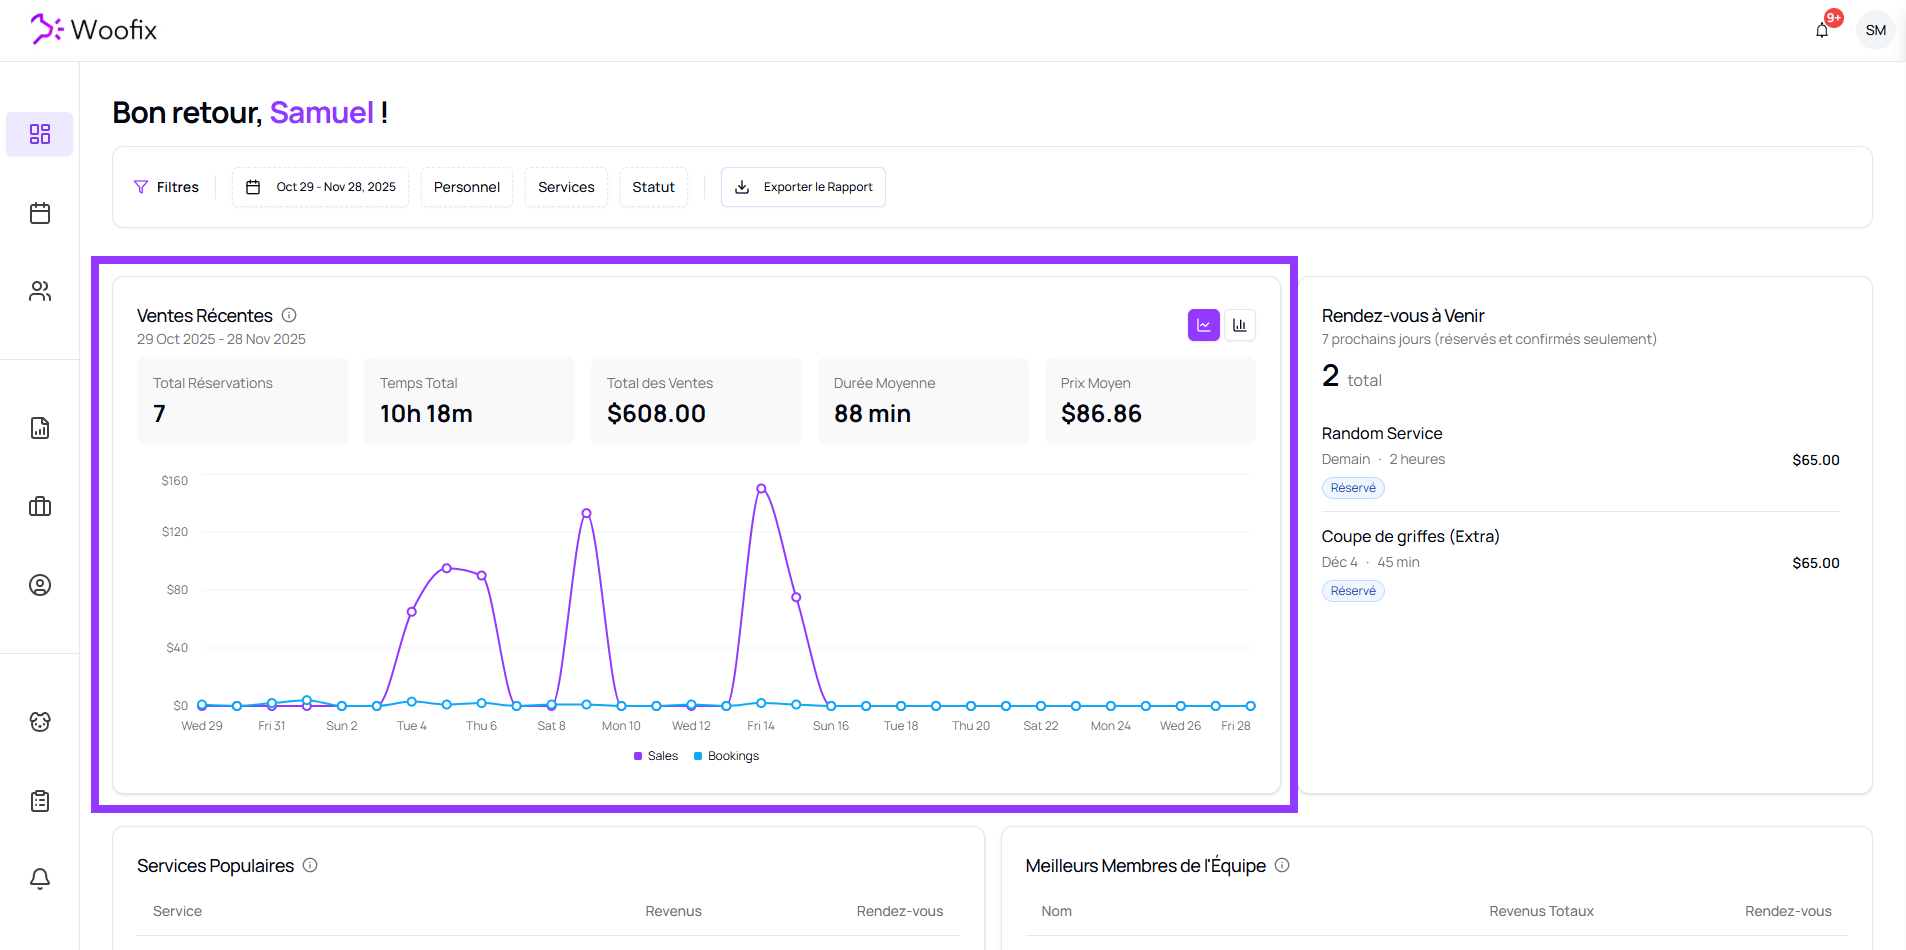
2. 📈 Recent Sales
Below the filters, you’ll find a chart that groups recent sales and the number of appointments based on the selected time period.
Above the chart, several key indicators are automatically updated:
- Total Appointments
- Total Time (cumulative duration of appointments)
- Total Sales
- Average Duration
- Average Price
These numbers are recalculated according to the filters applied.
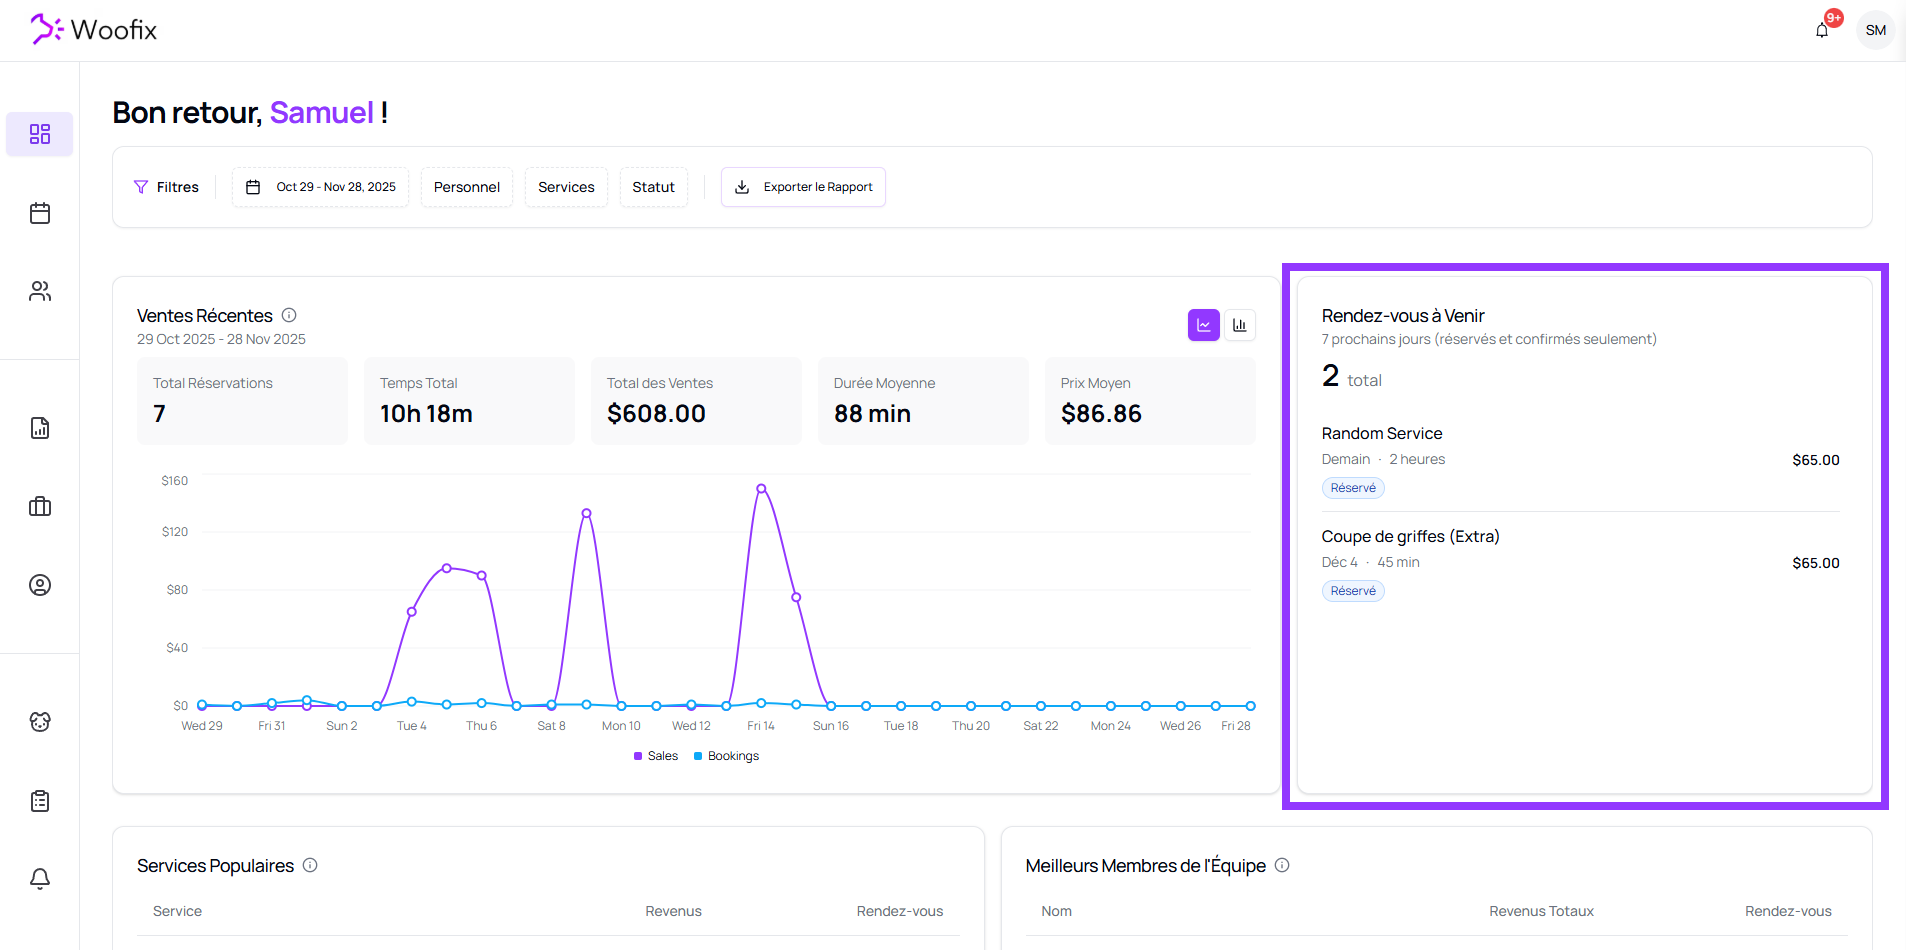
3. 📅 Upcoming Appointments
This section displays only the appointments scheduled in the next 7 days, with the following statuses:
- Booked
- Confirmed
Other statuses are excluded to focus on active upcoming appointments.
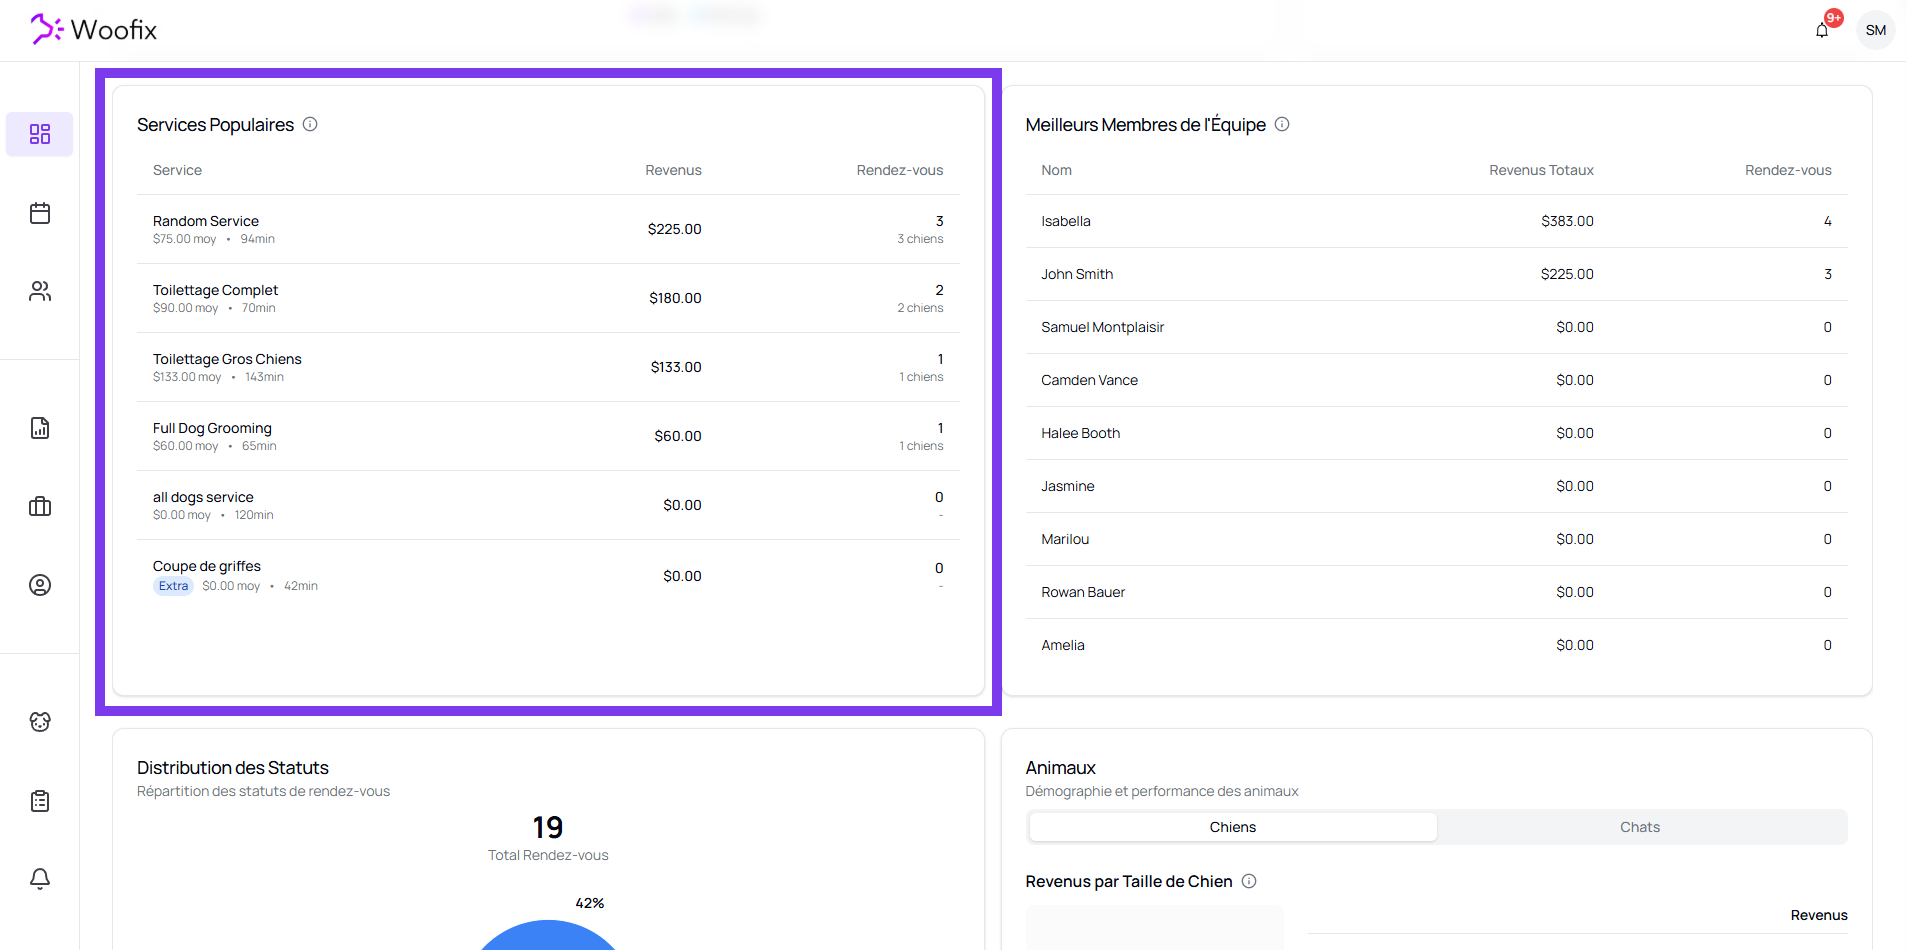
4. ⭐ Popular Services
This section presents the most requested services, along with:
- Revenue generated
- Total number of appointments associated with each service
Useful for identifying what brings in the most revenue and what clients choose most often.
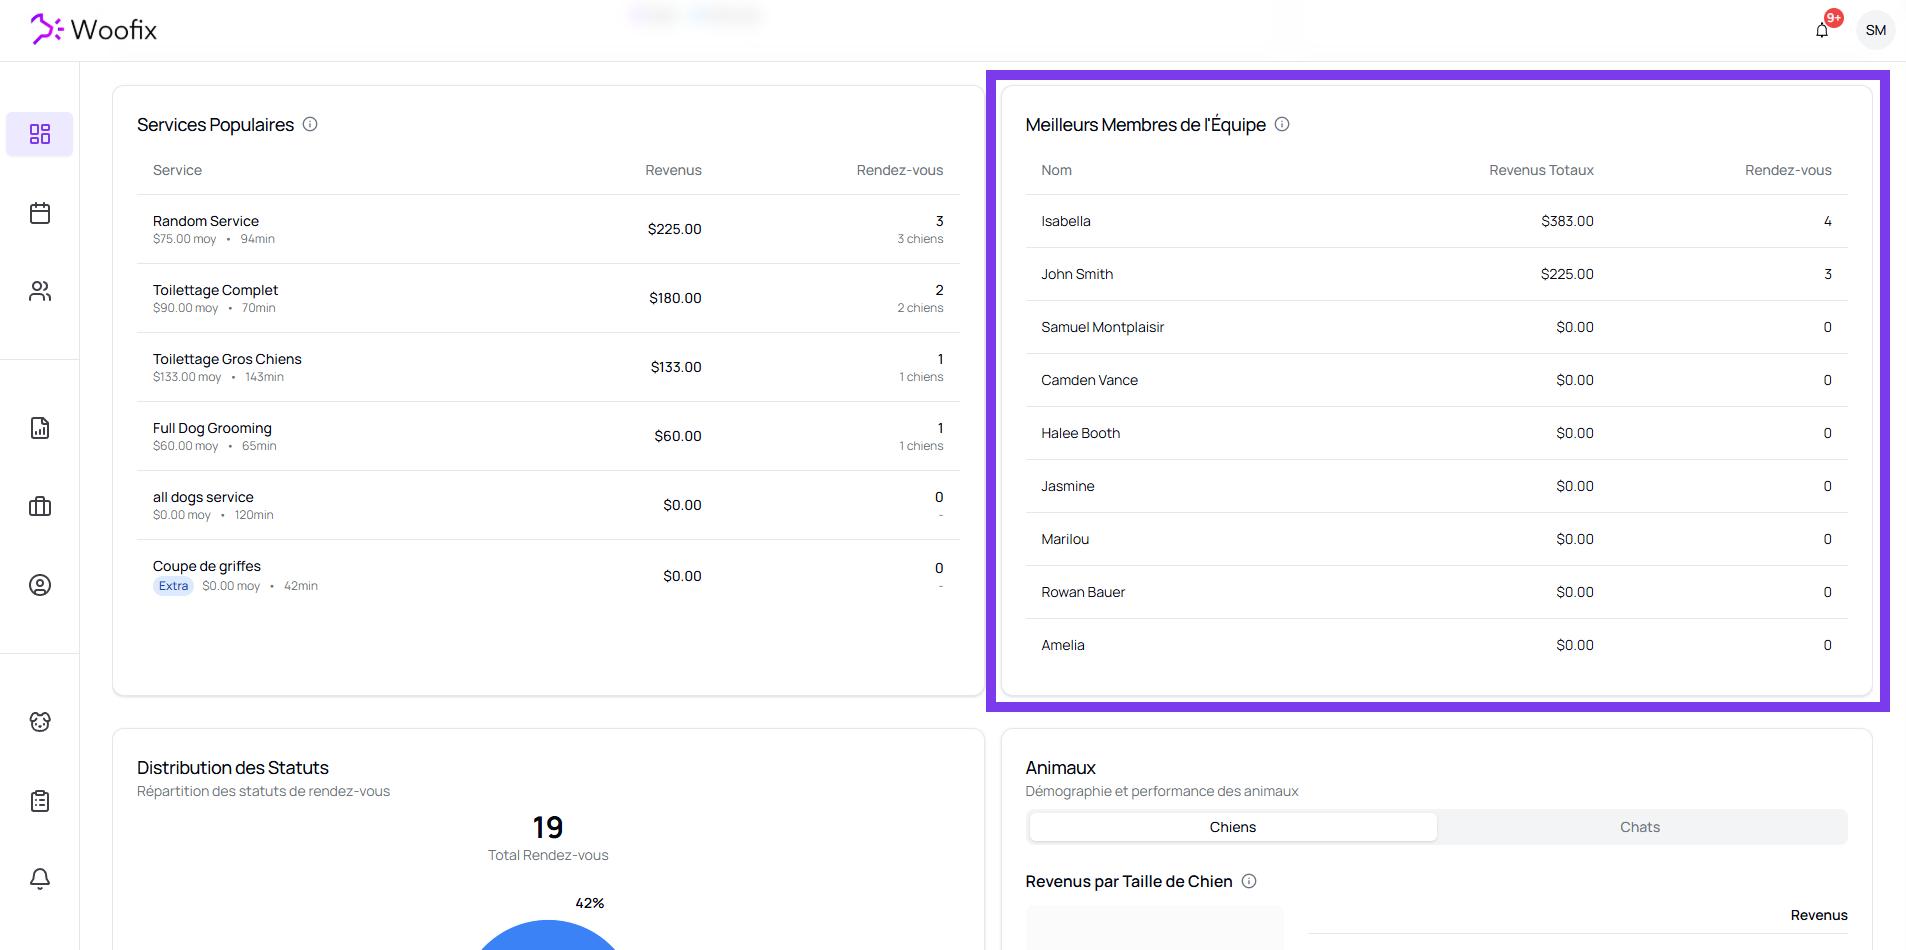
5. 🧑🤝🧑 Top Team Members
A list ranks groomers based on their performance:
- Total revenue generated
- Number of appointments completed
Ideal for analyzing your team’s productivity.
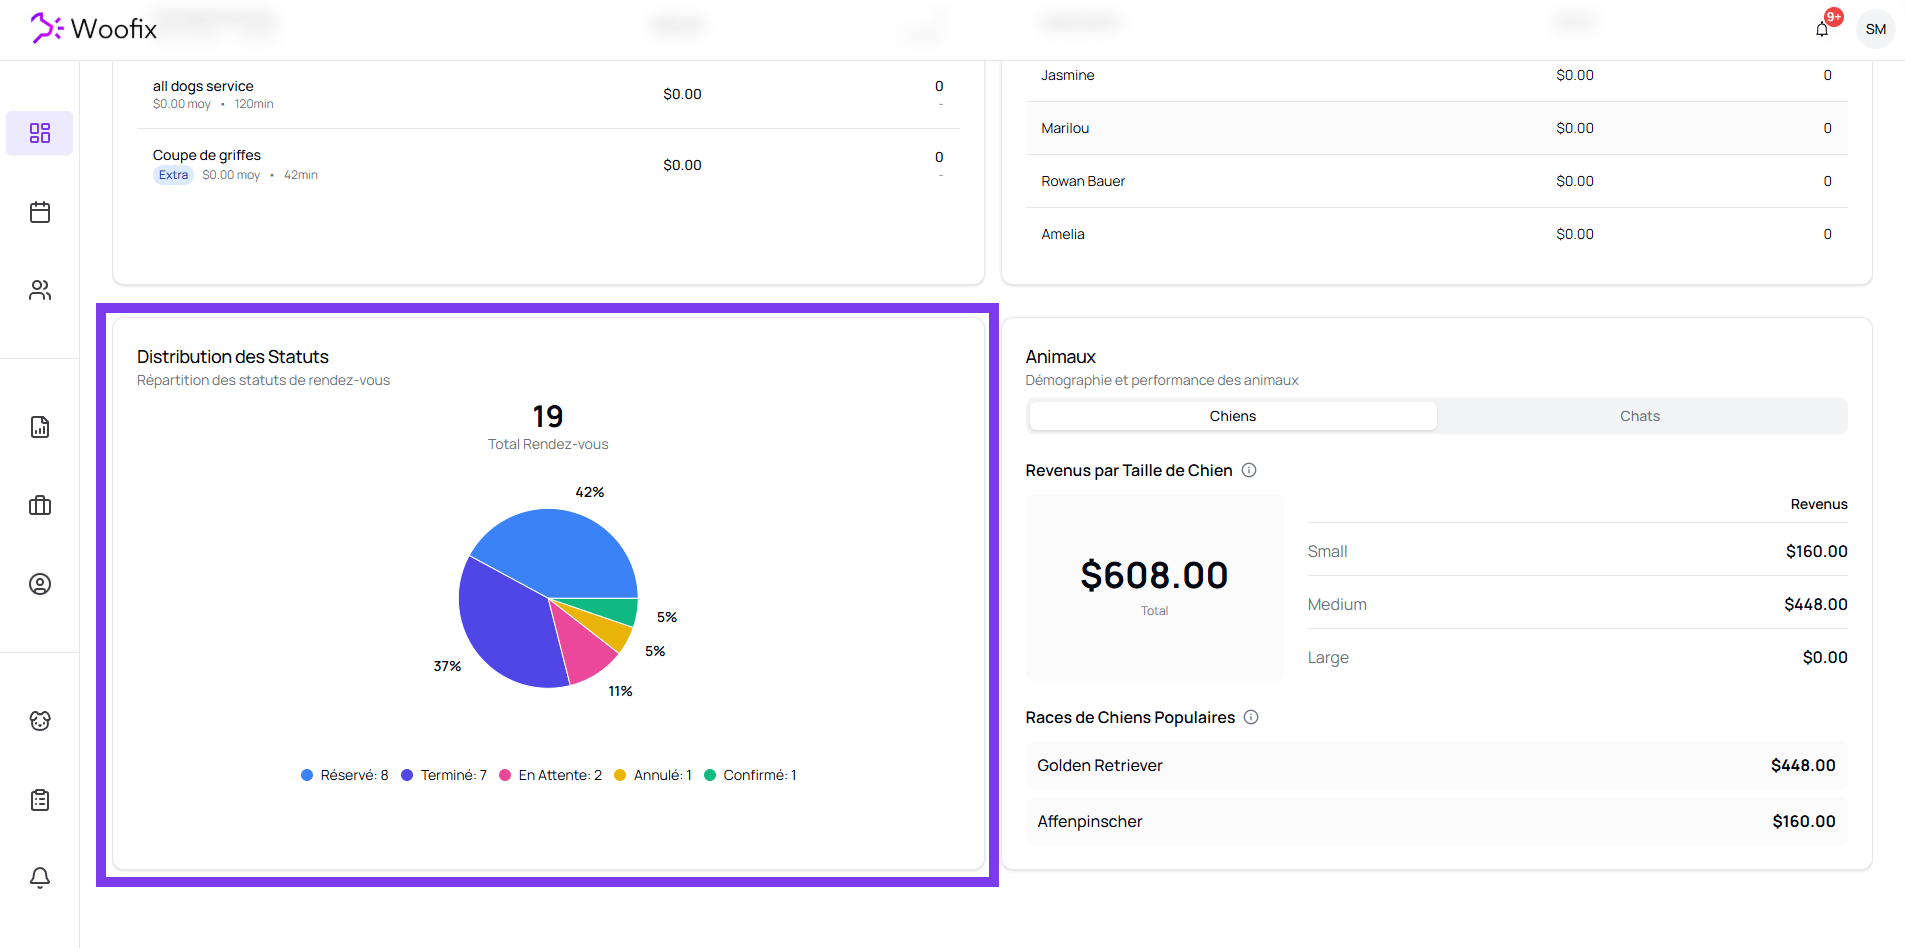
6. 🥧 Status Distribution
A pie chart shows the breakdown of appointment statuses:
- Total number of appointments
- Percentage by status
- Count per status
This makes it easy to visualize completed, cancelled, pending appointments, etc.
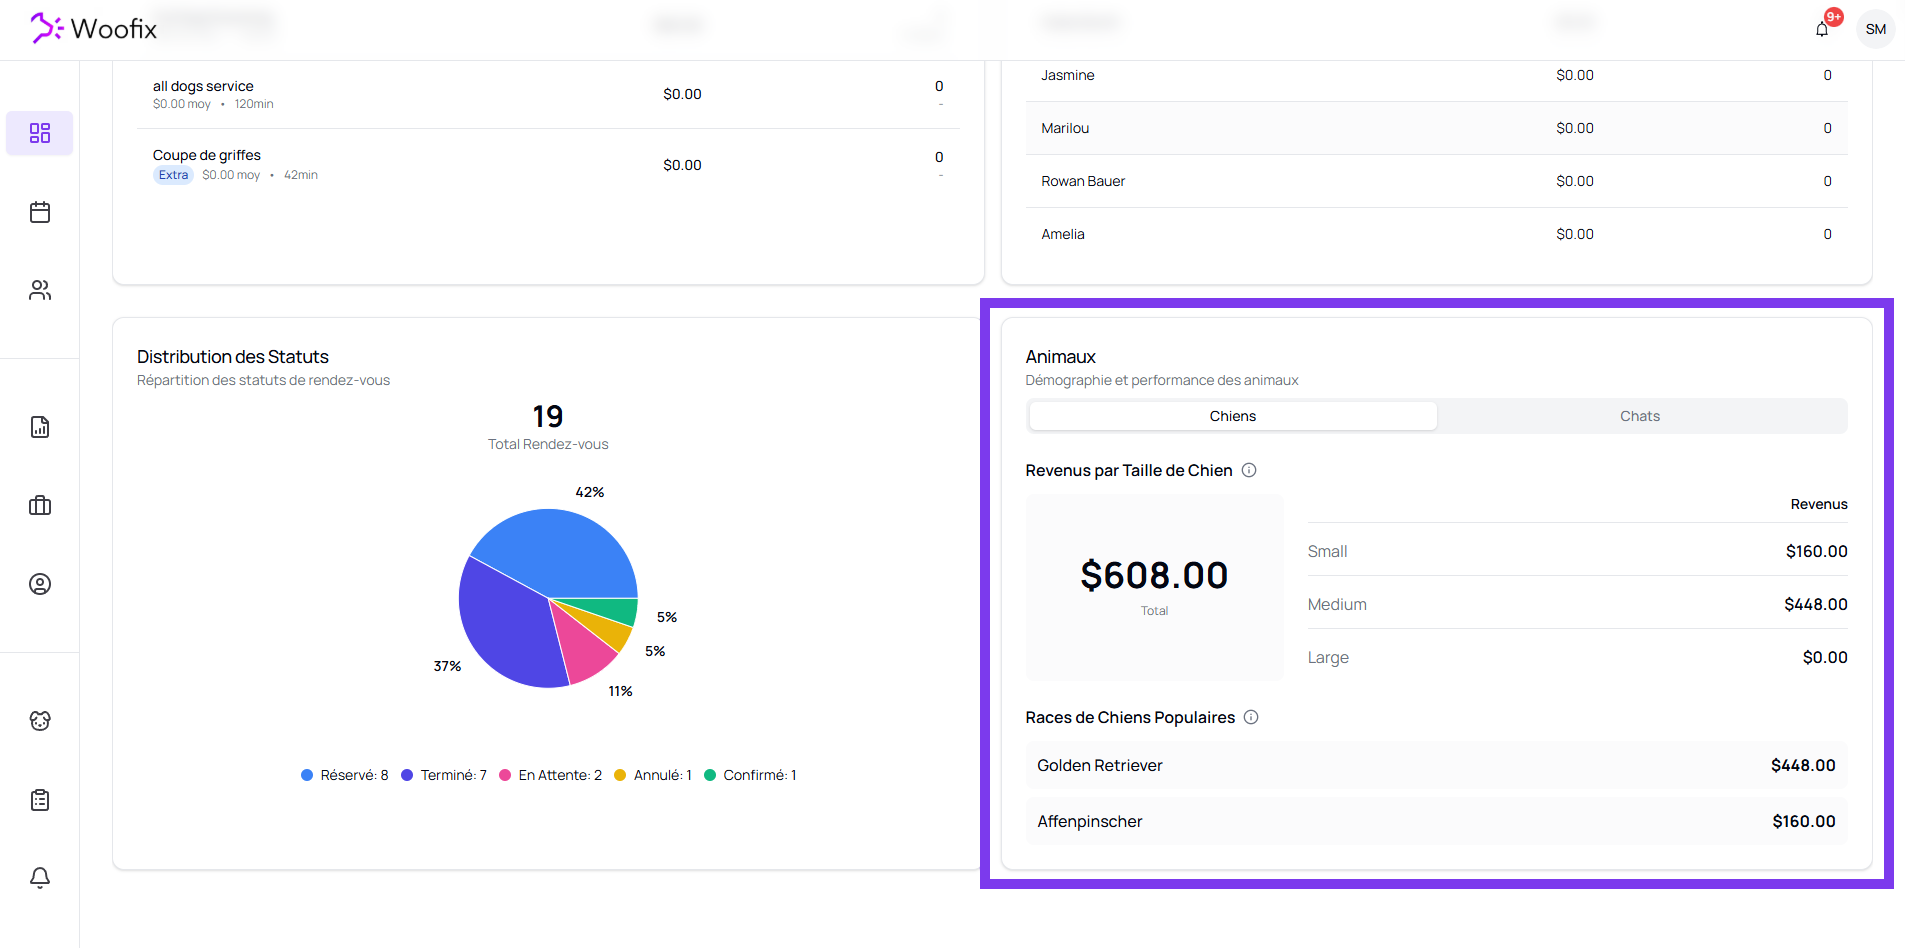
7. 🐾 Animal Demographics & Performance
This section allows you to analyze your revenue based on the type of animal.
7.1. Animal Type
You can switch between:
- Dog
- Cat
7.2. Dog Size
For dogs, revenue is broken down by:
- Small
- Medium
- Large
7.3. Popular Dog Breeds
A list displaying:
- The most common breeds
- Revenue generated per breed
Very useful for understanding your main client base.
✔️ Summary
The Woofix Dashboard centralizes:
- Advanced dashboard filters
- Recent Sales
- Upcoming Appointments
- Popular Services
- Top Team Members
- Status Distribution
- Animal demographics & performance
Everything automatically updates based on the filters you apply.